Watching an oxygen sensor output on an oscilloscope is like watching a sporting event on television. You get to see the action, but can do nothing about it as it happens.
Sometimes you miss the action and want an instant replay. It was a bad call. You saw the interference. If the referee didn’t see it, he can’t call it. The engine controller is like the referee in that it continuously monitors and controls engine operation. If the engine controller knows what cylinder is on exhaust stroke and which manifold contains the pressure wave, the controller will respond to the input from that oxygen sensor and change fuel trim.
The controller also uses as many as nine other inputs, such as rpm and throttle position, to affect fuel trim. If the engine controller is the final decision point for engine operation and the oscilloscope is an observer of one or more inputs, what is the diagnostic function of the oscilloscope? The simple answer is to find an anomaly in a signal trace, such as electromagnetic interference from a spark plug wire that would appear as a distortion of the sensor’s low voltage trace.
The scope is a last chance to find a problem like this because the controller didn’t see the interfering signal. The hard part about using a scope is finding a connector to make an observation. This can range from difficult to impossible. It is not good to poke holes in wires.
Using a scope can be useful if you know: what mechanical action generates the signal; where the signal is generated; and how the signal input affects the operation of a system. The following is an attempt to explain the what, where and how. It will also try to show the correlation of a scope trace to scan data.
Exhaust 101
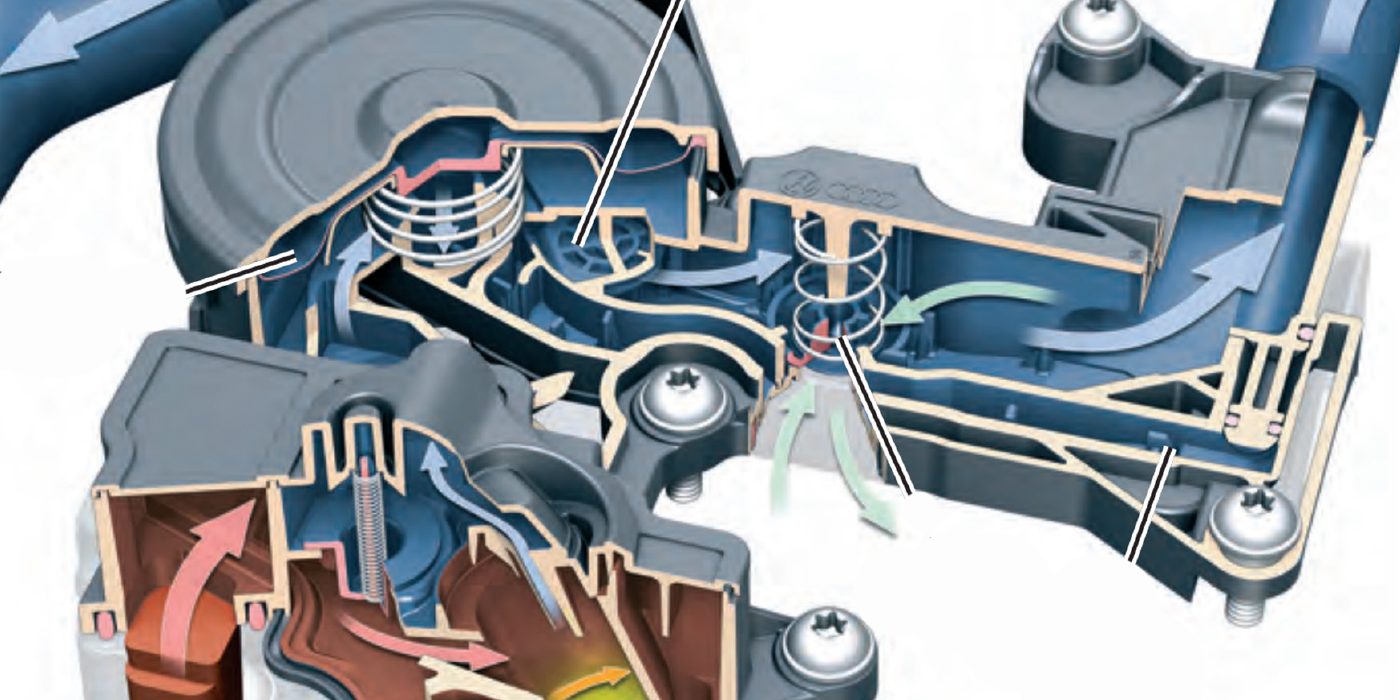
Each exhaust stroke of a piston or Wankel engine produces an exhaust pressure wave in the manifold and exhaust pipe. The pressure wave has three properties — amplitude, frequency and resonance.
Amplitude is a pressure wave generated by the speed and compression of the exhaust gas as it is driven by the piston or rotor into the manifold and pipe. The amplitude of the wave contains positive and negative pressure.
The positive pressure is the exhaust gas and the negative pressure is the space between the pressure waves. Frequency is the number of waves generated by the exhaust stroke at a given rpm. As engine speed varies, the amplitude frequency and the length of the pressure wave will vary.
 A four-cylinder engine produces two pressure waves for each crankshaft rotation and there is one primary oxygen sensor. In the case of a V-type engine, there are two primary oxygen sensors; one in each manifold. Each sensor will monitor half of the exhaust stream.
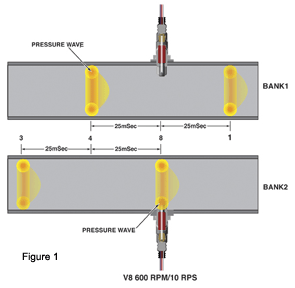
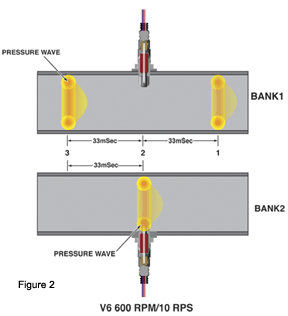
V8 engines produces four pressure waves per crankshaft rotation at two per manifold. At 600 rpm or 10 rotations per second (RPS) the V8 will produce a wave frequency of 40 positive pressure waves per second. This is a positive pressure wave every 25 mSec in each manifolds (Figure 1). Double the rpm to 1200/20 RPS and the frequency is 80 pressure waves per second with a positive pressure wave every 12.5 mSec. The V6 engine produces three pressure waves per crankshaft rotation. At 10 rps, there are 30 waves per second with a positive pressure wave every 33 mSec (Figure 2).
 Sensor 201
The oxygen sensor monitors the content of the pressure waves as they pass the sensor. With each pressure wave the sensor sends a rich or lean mixture voltage to the engine controller.
Based on the oxygen sensor voltage, the controller will increase or decrease the pulse width of the injector, which in turn will change the oxygen sensor voltage for the next injector pulse. The oxygen sensor is also referred to as a lambda (l) 1 sensor. Lambda is the Greek letter equivalent to “L”. Lambda (l) 1 is the reference voltage of 450 mV. l 1 represents an air fuel ratio of 14.7:1 or stoichiometric. The controller will drive the injector pulse from rich to lean and lean to rich to maintain a stoichiometric air fuel ratio.
An example would be like riding a bicycle on a three-inch wide line. As your eyes see the wheel approaching the edge of the line, the brain sends a message to the arms to steer the wheels away from the edge of the line. As you ride along the line, you are continuously making corrections to stay on the line.
The zirconium sensor operates like a thermocouple. The sensor uses a thimble-shaped sensor element with platinum electrodes. It produces a voltage that is dependant on temperature and the oxygen concentration in the exhaust as compared to an atmospheric reference oxygen source internal to the sensor.
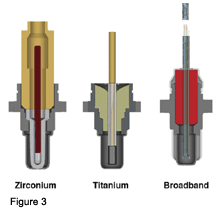 The sensor is capable of generating a one-volt signal when there is no oxygen in the exhaust stream. The scope will display a peak voltage for each pressure wave. The controller will store the information for fuel trim. Most sensors have a heater to bring the sensor to operating temperature during a cold start and then shut down.
The titania sensor construction is much the same as a zirconium sensor, but operates differently. A titania sensor uses a titanium dioxide element attached to a substrate and Platinum electrodes. It operates like a thermistor in a coolant temperature sensor.
The sensor does not require a reference oxygen source. At temperature, it changes resistance as the air/fuel ratio changes. But instead of a gradual change, it switches very quickly from low resistance, less than 10 K ohms when the mixture is rich, to more than 20 K ohms when the mixture is lean. The engine controller supplies a base reference voltage of one volt to the sensor. 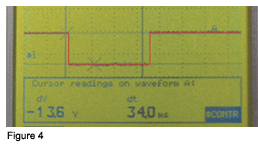 The l 1 reference voltage for the sensor is 450 mV. The sensor has a heater that operates continuously to bring the sensor to operating temperature using a pulse width modulated signal to maintain a constant temperature level for the sensing element. (Figure 4).
The broadband planar zirconium oxide air fuel sensor is a combination of a standard oxygen sensor and a pump cell that samples exhaust gas. A voltage is applied to the pump cell diffusion gap to maintain a constant sensing l 1 air fuel ratio through extreme rich and lean conditions. Input to the electronic circuit controls the oxygen concentration in the diffusion gap by changing the polarity of the current flow in the pump cell.
The changing polarity of the input and trim current flow causes the electronics to send a rich/lean switching signal to the PCM. The l 1 reference voltage for the sensor is 450 mV the same as the thimble-type sensor. The internal circuitry used in a wideband oxygen sensor produces a digital pulse width modulated signal that makes it quite different from a conventional oxygen sensor that produces an analog signal ranging from 0.1 and 0.9 volts.
An oscilloscope is real time graphing voltmeter that can monitor the activity of an oxygen sensor or, if equipped with a hold feature, to capture a time and voltage sequence. What will the oscilloscope tell you about the operation of the sensor? It will supply voltage and a time trace according to the setup of the scope.
The most important is the setup. The voltage per division on the display is a setting that is determined by the output of the sensor’s signal. The output of the titania and zirconium sensor is one volt. Use a setting of 200 to 500 mV per division.
Next is timing that will determine the number of mSec per division. The type of engine, number of oxygen sensors and engine speed will determine this setting. A setting of 200 to 500 mSec should be sufficient to capture idle to 2000 rpm for most four and six cylinder engines. With the correct settings of milli-volts and milli-seconds per division, you can capture the performance of the sensor. The waveform displayed by the scope can identify the type of sensor.
A scan tool diagnostic link connector (DLC) provides a connection that can provide the same information with an easy connection. The only thing the controller cannot do is observe and process the anomaly. The controller will set the trouble code and the scan tool will display it. A Class 2 diagnostic data link provided scan tool data for the oxygen sensor that can assist in diagnosing a system or component problem. The data can read air/fuel ratio, sensor response time, voltage changes and number of switching events.
The data is displayed in milli-volts, milli-seconds, switching events and rich lean response ratios. The data is assembled by the scan tool to display an oscilloscope trace.