Once considered leading-edge technology, today’s oxygen sensor has become a commonplace service item on modern vehicles. Popularly introduced in the 1970s, the Lambda or, as it’s more popularly known, the oxygen sensor, rapidly became standard equipment as it’s a vital component of closed-loop or feedback fuel control technology. By using a voltage input from the oxygen sensor, a powertrain control module (PCM) can verify that its fuel control strategy is producing a chemically perfect 14.7:1 (by weight) air-to-fuel combustion ratio.
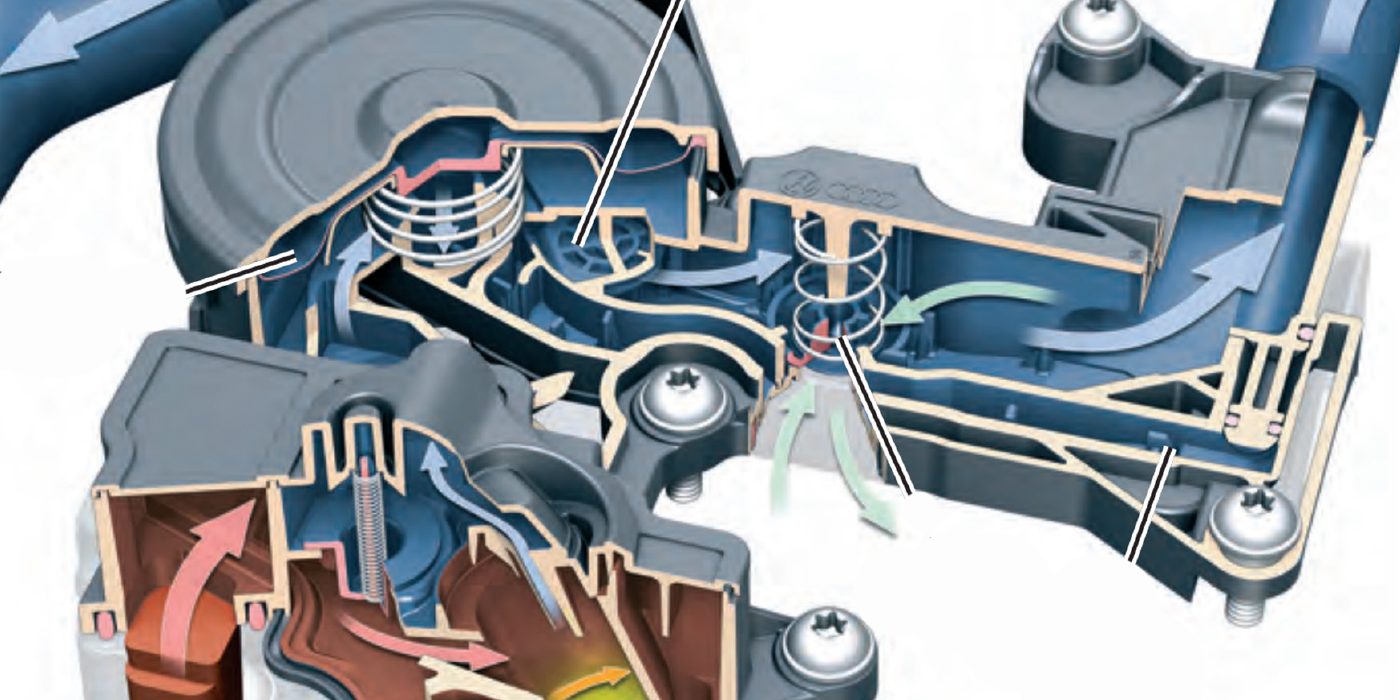
Before we venture into basic PCM operating strategies and diagnostic procedures, let’s review how a simple, single-wire zirconia oxygen sensor works in conjunction with the PCM. A closed-loop fuel control system must contain three essential components: an information processor (the PCM), an actuator (the fuel injector) and an exhaust gas sensor (the oxygen sensor). During a cold startup, the PCM operates briefly in an open-loop or fixed fuel-control mode until the oxygen sensor reaches at least 600° F operating temperature. In the open-loop mode, the fuel injector pulse width is controlled by engine speed, load and temperature. 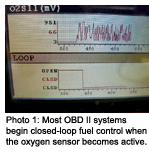 The fuel control system enters closed-loop operation when the oxygen sensor reaches 600° F operating temperature and begins generating a voltage signal to the PCM (See Photo 1). After entering closed-loop operation, the PCM begins switching the air/fuel (a/f) mixture between lean and rich by changing the fuel injector pulse width. In response, the oxygen sensor will generally return a signal ranging between 0.2 to 0.8 volts. A chemically perfect or stoichiometric a/f ratio is reached as the O2 sensor signal crosses the 0.5-volt middle range during the switching process.
To reduce cold-start exhaust emissions, heater circuits are installed on modern oxygen sensors to shorten open-loop operating time. With the added heating circuit, many oxygen sensors incorporate three wires. A fourth wire is added to most O2 sensors to ensure an adequate ground connection between the sensor and the PCM.
At this point, it’s also important to remember that a few import manufacturers installed 0-5-volt range titania oxygen sensors during the late 1980s and early 1990s. Unlike voltage-generating zirconia sensors, titania sensors change resistance in response to rich or lean a/f mixtures. Most titania sensor indicate a lean a/f mixture at higher voltages and rich mixtures at lower voltages.
EARLY DIAGNOSTICS
Oxygen sensor degradation is usually caused by ethyl-leaded gasoline, dirt, engine coolant and engine oil ash. Because leaded gasoline was still present in many fuel distribution chains in the 1980s, many early imports use a maintenance reminder light that usually triggered at 80,000 miles to warn owners that the oxygen sensor should be inspected or replaced.
Most OBD I computers are able to detect only a shorted to ground or open circuit in the oxygen sensor circuit. A grounded signal is distinguished by an absence of voltage, whereas an open circuit is distinguished by the presence of a “bias” voltage fed into the O2 sensor circuit by the PCM. The presence of a fixed voltage of 0.456 or perhaps 5.0 reference volts in the PCM’s datastream usually indicates an open-circuit O2 sensor circuit. In other applications, a PCM can detect a lean or rich fuel mixture by monitoring a sustained low or high voltage output from the oxygen sensor and storing a corresponding trouble code.
Although most of these systems can be diagnosed using a 10-megohm impedance volt-ohmmeter, most advanced technicians prefer using a digital storage oscilloscope (DSO) or, more popularly, a “lab scope” to display the oxygen sensor switching signal. By observing O2 sensor waveforms, skilled technicians can detect malfunctions in the fuel control system or even detect cylinder misfires by watching for a zero-voltage “gulp” of unburned fuel and air pass by the oxygen sensor.
OBD II OXYGEN SENSORS
OBD II diagnostics, which were popularly introduced in 1996, use multiple oxygen sensors not only to monitor fuel control, but also to monitor the efficiency of the catalytic converter. 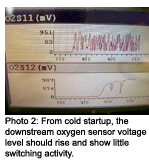 In the OBD II systems, an upstream O2 sensor measures the oxygen content of the exhaust “feed” gases entering the catalytic converter, while a downstream sensor located at the converter outlet measures the oxygen content of the exhaust gases exiting the converter. The PCM analyzes converter efficiency by comparing the switching rates of the upstream and downstream sensors. After the converter achieves operating temperature, the switching rate of the downstream sensor should become static (See Photo 2).
But OBD II oxygen sensor diagnostics are much more complicated because its diagnostic strategy measures not only the voltage range of the sensor, but the overall activity and responsiveness of the sensor. In essence, the OBD II PCM compares the O2 sensor’s voltage activity against a mathematical model that detects a sluggish or voltage-biased sensor. If the oxygen sensor exhibits a voltage value inconsistent with other data, the PCM stores the fault as a DTC in the PCM’s diagnostic memory and also stores the basic operating conditions at the time of the failure in the PCM’s freeze-frame data memory.
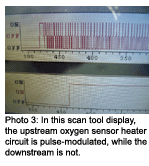 In addition, the PCM also monitors the oxygen sensor heater circuit activity by measuring the amperage flowing through the heater. On some vehicles, heater circuit activity occurs only during specific operating conditions (See Photo 3), so it’s much more important to rely on the PCM’s diagnostic capability than to rely on an intrusive diagnosis with a volt meter or labscope.
With that said, it’s also important to recognize that oxygen sensor diagnosis on OBD II vehicles is primarily a scanner-based function. In some cases, activity among the various upstream and downstream oxygen sensors can be compared by using a voltage graphing function that is often incorporated on professional-grade scan tools.
To illustrate how graphing can be used, the bank-to-bank oxygen sensor activity can be compared to locate and verify an intake manifold gasket vacuum leak or other fuel delivery irregularity. The graphing feature can also be used to verify catalytic converter function by comparing the relative activity between the upstream and downstream oxygen sensors. But, here again, scan tool graphing or intrusive diagnostics should never be used to measure catalytic converter efficiency.
 FUEL TRIM ANALYSIS
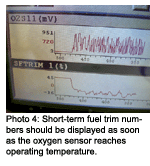
All OBD II data streams contain a short- and long-term fuel trim number. In most cases, a fuel trim number is displayed only for the upstream sensors. When using an OE scan tool, a fuel trim number may be displayed for the downstream sensor as well (See Photo 4).
In essence, the fuel trim number reflects the percentage of fuel that must be added or subtracted to keep the oxygen sensor voltage within a predetermined range. In general, the PCM will store a trouble code and turn on the MIL when a fuel trim number exceeds 25%.
AIR/FUEL RATIO SENSORS
While space won’t permit a comprehensive discussion of Air/Fuel Ratio (AFR) or “broad-band” sensors, suffice it to say they can measure a much broader range of upstream air fuel ratios than a conventional zirconia sensor. In most applications, an AFR sensor is used to measure upstream exhaust gases while a conventional zirconia sensor monitors downstream gases.
When diagnosing an air/fuel ratio trouble code, it’s important to determine if an aftermarket scan tool is “looking” at an AFR sensor or a conventional oxygen sensor. The most prominent physical difference between oxygen and AFR sensors is that the AFR connector will contain five wires. Second, the AFR sensor may display a constant voltage on the scan tool’s datastream or a set of manufacturer-specific fuel trim numbers.
Because the PCM is measuring current input into the sensor rather than voltage output from an AFR sensor, a bad AFR sensor should be diagnosed by looking for trouble codes and faulty fuel trim numbers. In addition, some import manufacturers have found it necessary to reprogram the PCM’s operating strategy to more accurately monitor AFR activity, especially after the AFR sensor has failed or been replaced. Consequently, a TSB or PCM calibration research should be a part of any modern AFR sensor replacement.