When confronted with a fuel control problem on a modern vehicle, I’ll normally use short- and long-term fuel trims to determine if the problem is caused by one of many failures such as a vacuum leak or a leaking fuel pressure regulator. If you’re like me, you’ll occasionally access the air/fuel ratio (AFR) sensor serial datastream to determine if the sensors are functioning as intended. But, modern aftermarket scan tools often display AFR sensor data in a conventional 0 to 1.0-volt format, lambda, equivalency ratio, AFR voltage, and even milliamperes, all of which can be confusing, even for veteran diagnostic technicians.
In the field, the lack of familiarity with a particular datastream can also lead to some serious diagnostic errors. So, let’s begin sorting out this datastream maze by looking at the basics of zirconium dioxide and AFR oxygen sensors.
ZIRCONIUM OXYGEN SENSORS
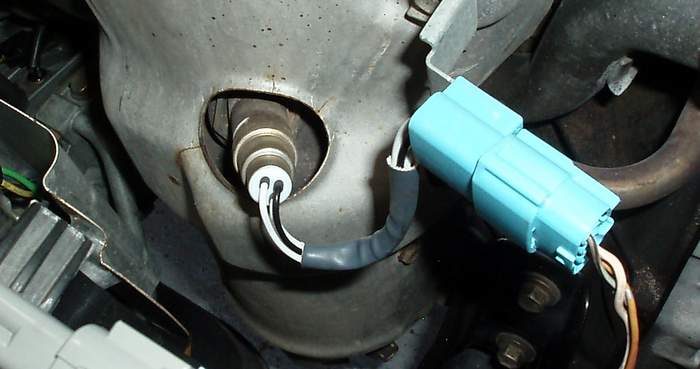
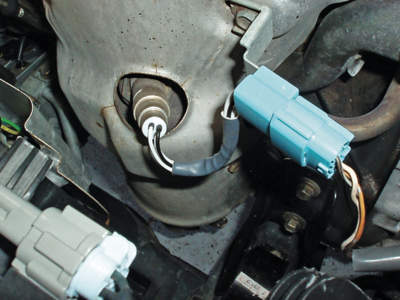
The zirconium-based oxygen sensor (see Fig. 1) is composed of a “thimble” made of zirconium dioxide. Modern fuel control systems incorporate heaters to help the thimble reach at least 600-700° F operating temperature so it can generate a voltage signal normally ranging between 0.100 and 0.900 millivolts (mV). This signal is generated by the voltage potential that exists between the exhaust gas flowing over the outside of the thimble and the atmospheric oxygen contained inside the thimble.
The atmospheric oxygen is supplied through vents in the outer metallic shield on the sensor or through the sensor signal wire connected to the PCM. Once the oxygen sensor is generating voltage and has established fuel control, the fuel management system enters “closed loop” operation.
Unfortunately, the zirconium-dioxide oxygen sensor is capable of maintaining only an average AFR over a very narrow range. At the extreme ends of its range, the zirconium sensor can measure only an approximate 14.2:1 (rich) to about 15.2:1 (lean) AFR. The less oxygen present in the exhaust stream (rich), the greater the signal voltage, and the more oxygen present in the exhaust stream (lean), the lower the signal voltage.
Because the zirconium sensor can’t perfectly measure the air/fuel ratio, the PCM constantly switches the air/fuel ratio between rich and lean. Although specifications among manufacturers vary, the switching frequency should be at least one complete cycle every 300 milliseconds. The exact midpoint of a zirconium sensor waveform should be 0.450 volts, which represents a chemically perfect stoichiometric AFR with a weight of 14.7:1. Stoichiometric can also be expressed as “lambda” or an “equivalent” AFR.
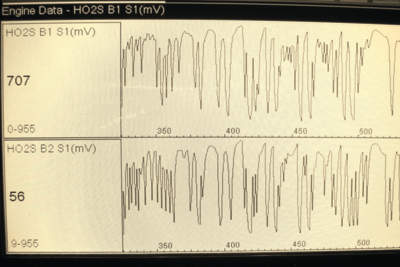
The most deficient aspect of zirconium oxygen sensors is that, when the required AFR is too far from stoichiometric (ex. wide-open throttle), the fuel management system goes into “open loop” and relies on a programmed, rather than calculated, air/fuel ratio. See Figures 2 and 3.
The zirconium oxygen sensors operating downstream of the catalytic converter are the exception to the above statement. While the downstream sensors are often used by many auto manufacturers to help manage fuel control, the main purpose of the downstream sensor is to monitor catalytic converter performance. Due to the minimal requirements of downstream exhaust gas monitoring, zirconium sensors are normally used in downstream applications.
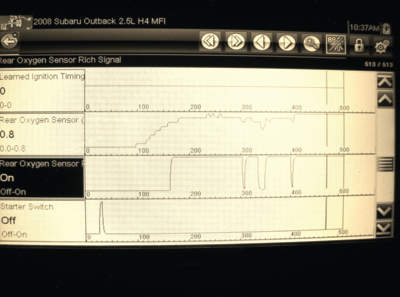
Consequently, the downstream zirconium sensor produces a constant voltage generally in the 600-700 mV range. In some cases, that voltage might vary due to an ignition or air/fuel misfire condition after the converter reaches operating temperature. See Fig. 4.
Remember that oil leaking onto older oxygen sensors will ruin the sensor’s calibration by sealing the shield vents against atmospheric oxygen. Because oxygen sensors are eventually contaminated by fuel, oil, coolant and silica deposits contained in the exhaust gas stream, oxygen sensor performance generally begins to decline after 100,000 miles of operation.
WIDEBAND AFR HIGHLIGHTS
Unlike the conventional zirconium dioxide oxygen sensor, the modern “wideband” AFR sensor will measure air/fuel ratios ranging from as rich as 10:1, to as lean as 22:1. The fact that AFR sensors operate continuously in closed loop makes them especially suitable for gasoline direct fuel injection and other types of “lean-burn” engines. The first wideband or AFR sensor appeared when Honda introduced its Linear Air/Fuel (LAF) sensor during the 1992 model year.
While the following is a very condensed version of LAF sensor operation, it will illustrate how an AFR sensor basically operates. If you want to dig deeper into AFR sensor operation, you can access more detailed information through the websites of most major AFR sensor manufacturers.
Honda’s original LAF sensor consists of two zirconia thimbles that are assembled, one inside the other, to form a diffusion chamber between the two. The outer thimble (No. 1) is exposed to the exhaust gas stream, while the inner thimble (No. 2) is exposed to atmospheric air. The outer thimble generates a voltage like a conventional oxygen sensor.
The inner thimble is activated by a low-voltage, very low amperage electrical current flowing from the PCM through the thimble to form an electrical “ion pump.” The ion pump controls voltage output at thimble No. 1 by adding or subtracting ions from the diffusion chamber. By monitoring the amperage and polarity of the current required to maintain 0.450 volts output at the outer thimble, the PCM can sense very rich and very lean air/fuel ratios.
Since Honda’s LAF sensor was introduced, other manufacturers have introduced their own versions of single-cell and dual-cell AFR sensors. While the single-cell AFR sensor isn’t electronically interchangeable with a zirconium sensor, the single-cell AFR sensor generates a similar voltage.
The dual-cell sensor incorporates a planar design that uses a flat zirconia dioxide element that’s about 1.5mm thick. The advantages of the planar design include quicker warm-up times, faster switching times and greater resistance to contamination.
In contrast to a zirconium oxygen sensor, a modern AFR sensor must achieve a minimum 1,200° F operating temperature before it can generate a signal.
For that reason, modern AFR heating circuits are pulse-modulated, which means that amperage or current flow testing is best done with an inductive amp probe and labscope. The mechanical and electrical construction of the modern AFR sensor has also become more complex and application-specific, with most AFR sensor connectors having at least five wires.
PLANAR AFR SENSORS
Although the basic operating principles of the wideband oxygen sensor haven’t changed, modern AFR sensors use a planar design incorporating a “Nernst” cell that generates a voltage signal to the PCM. When O2 content is high (lean), the Nernst cell sends a low-voltage signal to the PCM. The PCM reacts by sending a positive amperage signal that pumps more oxygen ions from the reference chamber, through the diffusion chamber and into the exhaust stream.
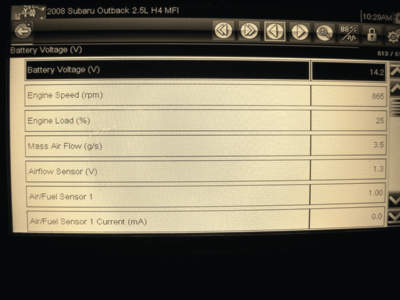
This ion flow brings the voltage signal of the Nernst cell back to a desired level of 0.450 volts. When oxygen content is low (rich) in the exhaust stream, the PCM sends a negative amperage signal to bring the Nernst signal back to 0.450 volts. If your scan tool indicates zero amperage, the AFR is at lambda or stoichiometric. If the displayed amperage is positive, the air/fuel ratio is lean; if it’s negative, it’s rich. See Fig. 5.
AFR DATASTREAMS
Just recently, I was using an aftermarket scan tool to display data from two upstream AFR sensors and two downstream oxygen sensors. As mentioned above, the AFR sensor’s signal return to the PCM can be a voltage signal or a very low-amperage positive or negative current. But thanks to various regulatory requirements, the AFR sensor data can be displayed in the more familiar 0.1-volt to 0.9 v-volt switching pattern of a zirconium sensor.
The AFR data can also be displayed as an air/fuel ratio and lambda. Lambda at stoichiometric is displayed as lambda 1.0. Numerical values above lambda 1.0 indicate a lean AFR, while values below lambda 1.0 indicate a rich AFR.
To further confuse the issue, the AFR data can also be displayed as a specified voltage range. To illustrate, OE service data indicates that the upstream AFR sensors on a 2006 Toyota Tundra pickup operate within a range of 0.00 volts to 7.999 volts. At idle, lambda is between 2.8 volts and 3.8 volts. In the field, we’ll probably see 3.28 volts representing lambda or stoichiometric. Other manufacturers have different voltage parameters, so it pays to take some notes and perhaps store some known-good graphs and numerical values in the scan tool’s memory for future reference.
SCAN TOOL GRAPHING
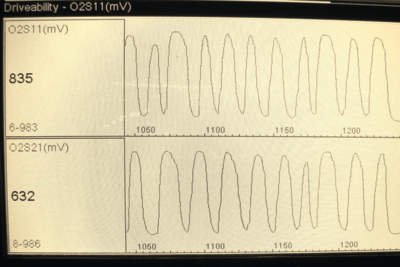
If an O2 or AFR sensor doesn’t store a diagnostic trouble code (DTC), but the diagnostic technician believes he might be dealing with a defective sensor, he might compare the voltage graphs of the right-bank and left-bank O2 or AFR sensors. Graphing voltages, as illustrated above, are perhaps the most convenient method of comparing bank-to-bank and downstream oxygen sensor activity.
For example, a lean condition caused by a defective mass airflow sensor should affect both upstream AFR or zirconium sensors, whereas a vacuum leak on one cylinder bank would affect only the individual sensor. Looking at figures 2 and 3 as a reference, it’s also very easy to see the differences in patterns between new and old zirconium sensors.
In any case, it will pay to not only familiarize yourself with the AFR and oxygen sensor datastreams displayed by your own scan tool, but also to better understand the underlying principles behind modern fuel system management.